I got laughed at for my answer about VIEWs. So I brought up MySQL 8.4 and PostgreSQL 17 and measured
At one interview I was asked about VIEWs. I answered honestly: in real projects I had barely run into them; for aggregates it is safer to keep a separate table; and views themselves are such a niche thing that they had come in handy a handful of times over my whole career. Permission separation, long migrations, compatibility with old software — that was the entire list. The answer went over coldly. One of the interviewers said, "You understand nothing about VIEWs," and everyone laughed.
A lot of time has passed. The number of VIEWs in my code never grew, but the question stayed with me: what if things have changed since then? New engines have shipped. So I brought up MySQL 8.4 and PostgreSQL 17, loaded identical data into both, and ran the main scenarios one after another.
The test rig
Docker Compose, MySQL 8.4.11 and PostgreSQL 17.11, an online-store schema: orders, line items, payments, a merchant reference table. The data is deterministic and byte-for-byte identical in both databases — a million orders, two million line items, 780 thousand payments, a hundred merchants, dates spanning 21 months. The set of views mirrors across both engines: a plain wrapper, a daily aggregate, a three-level cascade, a trap with ORDER BY inside, plus — in PostgreSQL only — a materialized view with a unique index.
I measure server-side time: in MySQL the root actual time from EXPLAIN ANALYZE, in PostgreSQL the Execution Time. Two warm-ups, seven measurements, take the median. The measurement itself inflates the time of small queries several times over, so only identical queries are worth comparing. Comparing absolute milliseconds against another machine makes no sense. Two memory settings: PostgreSQL keeps the default work_mem of 4 MB, MySQL runs with temptable_max_ram at 1 GB. The query window is the same everywhere — June 2026, merchant with ID 42.
A simple view consumes no extra resources
A wrapper over orders with no aggregation: one and a half to two milliseconds in both engines, the spread stays within noise, and the plans match those of the direct query. MySQL folds the definition into the query (the MERGE algorithm), PostgreSQL expands the view through the rewrite rule before the planner even sees it. The optimizer simply does not notice that you queried a view.
The result is boring, and boring is the best case here. A reusable filter and a read contract cost nothing.
One CAST, and the view is thirteen times more expensive
CREATE VIEW v_merchant_daily AS
SELECT o.merchant_id,
       CAST(o.created_at AS DATE) AS day,
       COUNT(*)                   AS orders_cnt,
       SUM(o.amount_total)        AS revenue
FROM orders o
WHERE o.status IN ('paid', 'shipped', 'completed')
GROUP BY o.merchant_id, CAST(o.created_at AS DATE);
The query on top of it is exactly what anyone would write:
SELECT * FROM v_merchant_daily
WHERE merchant_id = 42
  AND day >= '2026-06-01' AND day < '2026-07-01'
ORDER BY day;
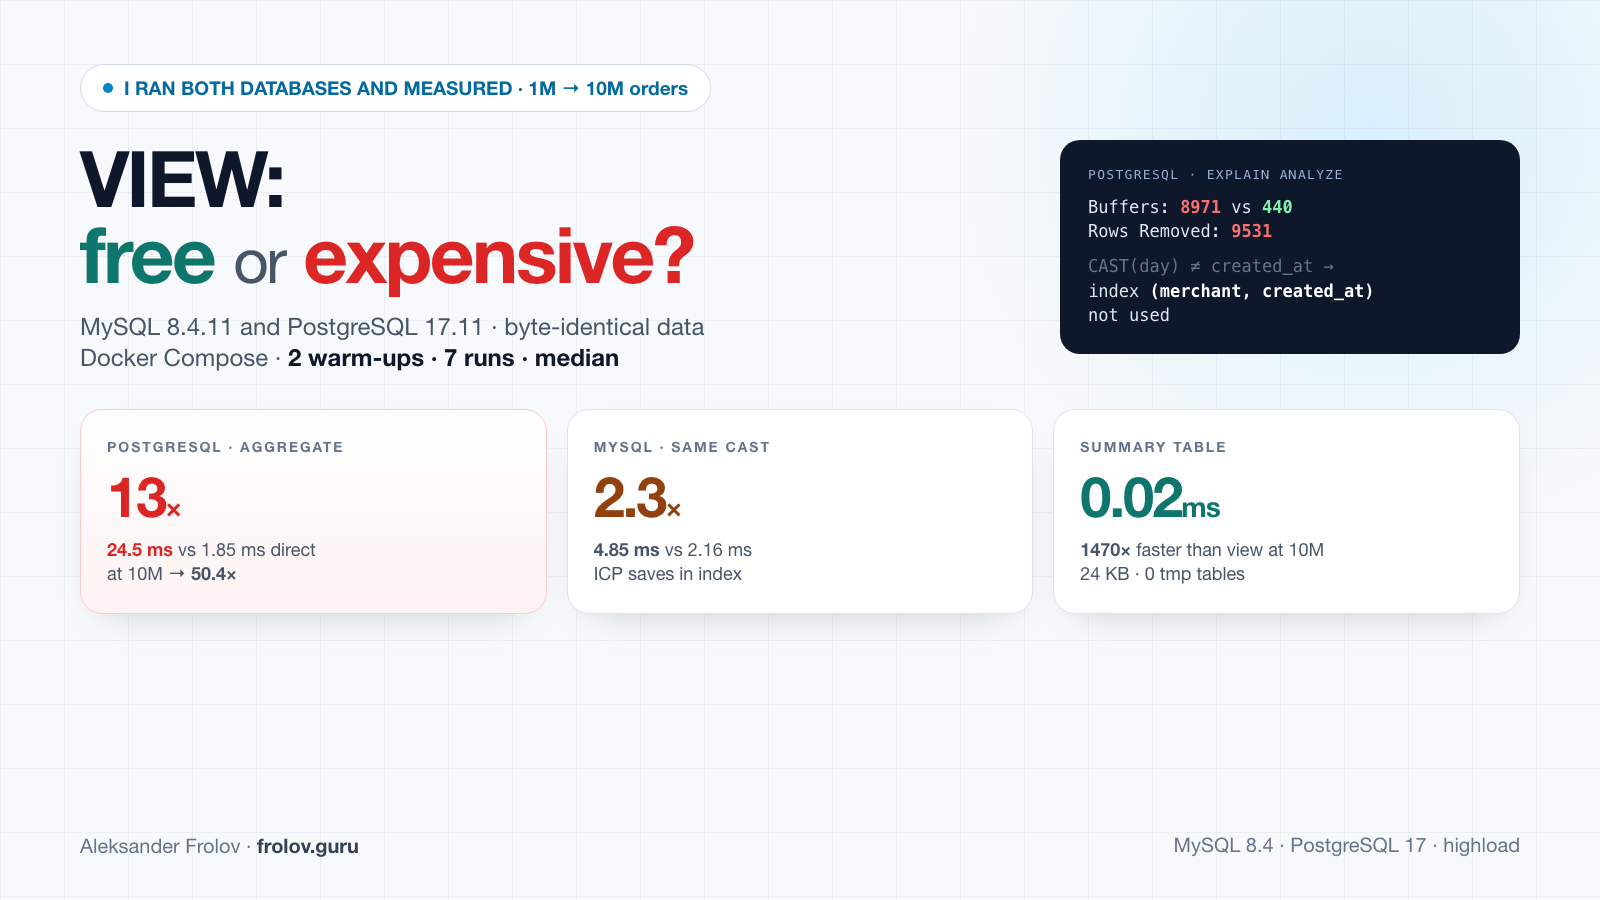
PostgreSQL returns this in 24.5 ms, while the same result fetched directly from the table takes 1.85 ms. A thirteenfold difference out of nowhere.
My first version of the explanation was the same one you find in half the articles about views: "the aggregate is computed before the filter, the engine groups the whole table and then throws away what it does not need." I opened the plan and found out I was wrong.
GroupAggregate (actual time=26.702..26.897 rows=30)
  ->  Sort (rows=469)
      ->  Bitmap Heap Scan on orders o (actual time=3.661..26.505 rows=469)
            Recheck Cond: (merchant_id = 42)
            Filter: (status = ANY (...)) AND ((created_at)::date >= '2026-06-01') AND ...
            Rows Removed by Filter: 9531
            Heap Blocks: exact=8929
            Buffers: shared hit=8971
            ->  Bitmap Index Scan on idx_orders_merchant_created (rows=10000)
                  Index Cond: (merchant_id = 42)
No aggregation of the whole table anywhere. Both predicates travelled below the GROUP BY, down to the scan: the planner knows how to push conditions on grouping columns, and both merchant_id and day are grouping columns. Exactly 469 rows get aggregated, the same as in the direct query.
The difference sits in a different line. Rows Removed by Filter: 9531 and Heap Blocks: exact=8929. In the direct query the index on (merchant_id, created_at) handles both columns and fetches 469 rows. Through the view, the condition arrives as CAST(created_at AS DATE) >= '2026-06-01' — that is an expression, not a column, and it cannot serve as a range bound on the index. What remains is the merchant condition: all ten thousand of that merchant's orders across 21 months are pulled out of the heap from scattered pages, and only there do 9531 rows get discarded by the filter.
That comes to 8971 buffer accesses against 440 for the direct query.
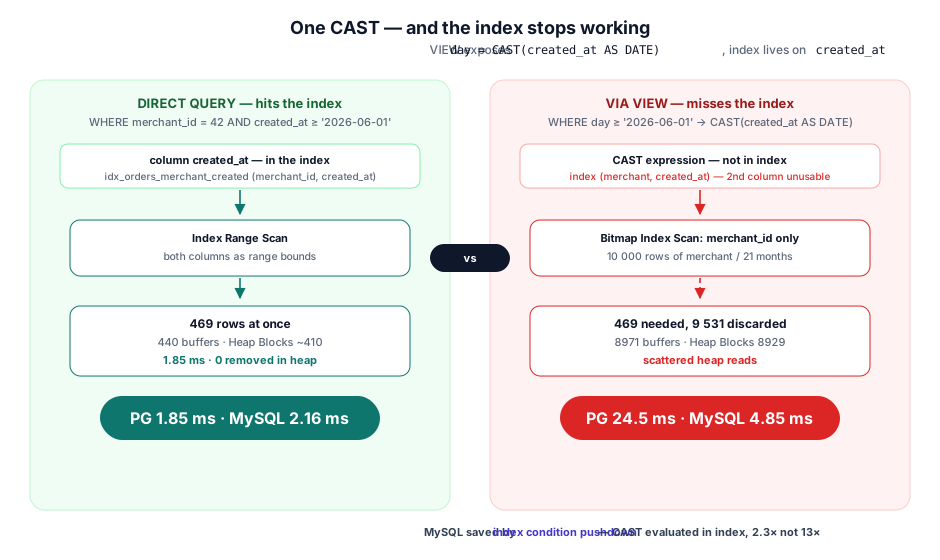
day, index lives on created_atMySQL spends 4.85 ms against 2.16 ms in the same spot — a little over two times, not thirteen. The mechanism is the same: an aggregating view in MySQL is always TEMPTABLE (the presence of GROUP BY rules out MERGE), and the conditions are pushed inside by derived condition pushdown. What saves MySQL is that it evaluates the CAST right in the index — index condition pushdown — so candidate rows are never lifted out of the table at all; they are cut off at the level of index records.
A subquery with the same text took 26.9 ms, a CTE took 24.6 ms. So the problem is not CREATE VIEW but the semantics: any construct with the same grouping behaves the same way.
The trouble with an aggregating view is not that it "computes before it filters." The trouble is that it exposes day to the outside world while the index lives on created_at. The view honestly hands you a column that cannot reach the index, and it does so silently, because a view's interface looks exactly like a table's.
Ever since, whenever I see CREATE VIEW ... GROUP BY in a pull request, I ask which columns it exposes and whether there are indexes underneath them. Eight times out of ten that is enough.
The cascade that turned out faster than the direct query
Three levels: a daily aggregate, a sum on top of it, a join with the reference table at the very top. Every level is recomputed on every access. The obvious expectation is that the deeper the stack, the worse it gets.
PostgreSQL confirmed the expectation: 832 ms against 243 ms for the single-pass query.
MySQL refuted it: the cascade took 1436 ms against 2432 ms for the direct query. A stack of three views turned out almost twice as fast as a handwritten single-pass query.
The reason is the shape of the join. The direct query joins orders with the reference table before grouping, using a nested loop: loops=750000 point lookups by primary key. In the cascade the join moves all the way to the top, where after two aggregations only 75 rows are left out of 750 thousand. The funnel 750000 → 48000 → 75 is visible in the plan in its entirety.
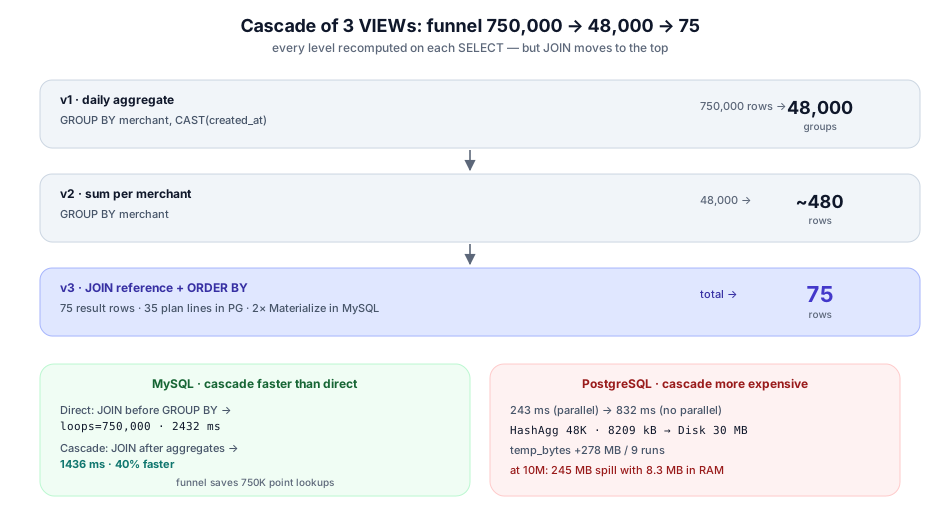
In PostgreSQL the same cascade revealed something else. The direct query runs in two parallel workers with a single HashAggregate. The cascade loses parallelism, and the intermediate 48 thousand groups do not fit into the 4 MB work_mem:
HashAggregate (rows=48000)
  Planned Partitions: 32  Batches: 33  Memory Usage: 8209kB  Disk Usage: 30224kB
That is 30 MB spilled to disk per execution. Across a series of nine runs the temp_bytes counter in pg_stat_database grew by 278 MB — for a query that returns ten rows. On ten million rows the same cascade spills 245 MB while holding 8.3 MB in RAM: PostgreSQL grows on disk, not in memory.
Whether a cascade is expensive is a question not of depth but of the join plan and the memory settings: change work_mem and the numbers move. A cascade's plan is unreadable. Two nested Materialize → Aggregate using temporary table steps in MySQL, thirty-five lines of output in PostgreSQL, and all of it for a ten-row report. When a report like that stalls in production on a Thursday evening, finding which level lost the time is a job for your eyes. You cannot predict in advance whether a cascade will help or sink the system — you can only test it. And test it at production volumes: on a test database the planner will show you a completely different picture.
ORDER BY inside a view
A codebase classic: CREATE VIEW ... ORDER BY created_at DESC, "so that it is definitely sorted." Both engines answer a LIMIT 10 on top of such a view instantly, in hundredths of a millisecond: both read the index backwards and take ten records. With a filter on top, PostgreSQL manages 0.17 ms and MySQL 4.18 ms, and neither plan contains a sort at all — the index already provides the required order.
The numbers here are uninteresting. The semantics are what matters: the SQL standard does not guarantee the order of rows a view returns, and the MySQL documentation says so in plain text. Today the plan happened to line up and the data looks sorted. Tomorrow the optimizer recomputes its statistics, picks a different access path, and code that silently relied on ordering starts returning a "random" ten. A bug like that does not crash, does not get logged, and surfaces six months later as a user complaint.
Materialized views and the cache question
Native materialized views exist only in PostgreSQL. Reading from mv_merchant_daily with a unique index takes 0.24 ms against 24.5 ms for the live aggregate — a hundred times faster.
The price sits on the other side. A REFRESH on a million orders takes 1146 ms, and it is always full: PostgreSQL has no incremental refresh. After inserts that touched a few hundred rows, the REFRESH still took the same 1200 ms — the delta changes nothing. It writes to disk exactly the way the cascade does, the same ~30 MB of temporary files per execution.
It is tempting to write the hundredfold difference off as caching — "the engine remembered the answer." But neither engine has a result cache. MySQL removed the Query Cache in 8.0, PostgreSQL never had one; only data pages are cached.
The check is simple: thirty repetitions of the same query through the aggregating view, back to back. MySQL's median is 4.37 ms with a maximum of 5.95; PostgreSQL's is 21.7 ms with a maximum of 25.2. A flat series — every run computes the answer again.
The counters say the same thing in different words. In PostgreSQL the heavy aggregate is served entirely from a warm pool: 9456 hits, zero disk accesses, 23 ms. Reading the materialized view is about a hundred hits and 0.24 ms. Both queries read equally warm pages and differ by a factor of a hundred, so the difference is purely computational. In MySQL the picture reads in InnoDB terms: zero physical reads per run, 5883 logical reads from the buffer pool, and Created_tmp_tables +7 — temporary tables are born and die with every execution.
A materialized view is faster not because it "gets cached" but because there is nothing left to compute.
What reading from a view does to writes
Fifteen-second insert windows, in batches of eight hundred rows. The baseline is inserts only. The second scenario adds two background readers hammering the aggregating view continuously.
Write throughput dropped by 7% in MySQL and by 16% in PostgreSQL. Meanwhile, the readers were getting around seventy queries per second with a median of 7 ms.
A control scenario replaced the live view with a summary table that the writer maintains through an incremental upsert on the affected groups. The inserts did not drop at all: 24000 rows against 22400 for the baseline in MySQL, 20800 against 20000 in PostgreSQL — plus 7% and plus 4%, which is pure noise from background load on the host. I verified snapshot consistency separately.
A view by itself does not get in the way of writes. What gets in the way is a constant reader of a heavy aggregate: it shares resources with the writer and pays for each of its reads with a full recomputation. Maintaining a summary table on the writer's side costs nothing.
The cost depends on the volume, not on the query
The same scenarios on ten thousand orders, then on a million, then on ten million.
| Orders | MySQL, view/direct | PostgreSQL, view/direct |
|---|---|---|
| 10,000 | 1.6× | 2.7× |
| 1,000,000 | 2.3× | 10.7× |
| 10,000,000 | 2.5× | 50.4× |
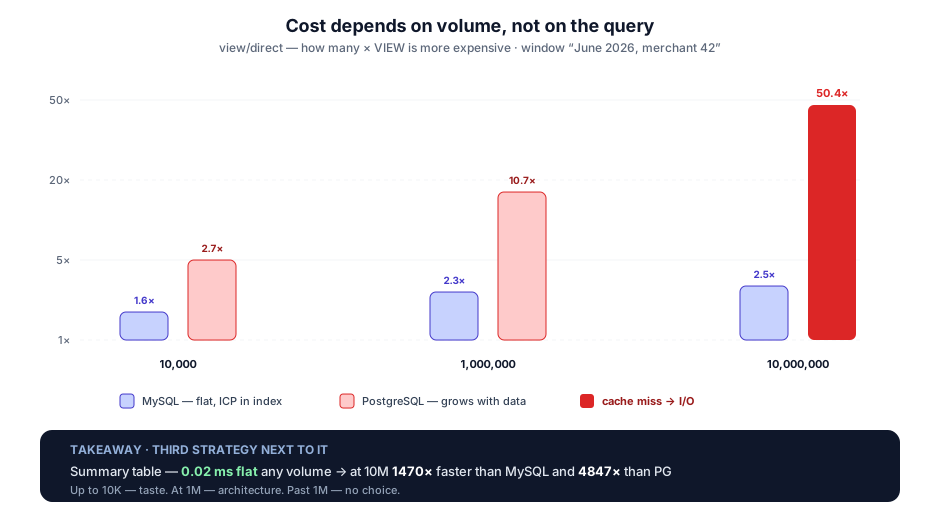
MySQL holds steady across the whole range: index condition pushdown works at any volume, and the extra rows are cut off inside the index. In PostgreSQL the gap grows along with the data.
Mechanically it is the same CAST: the view always reads all the merchant's orders while the direct query reads only the June ones. For this data window that is exactly a 21-fold difference in input, and it does not depend on volume. Yet the measured gap grows from 2.7× to 50×, outrunning that ratio by more than a factor of two. I did not capture plans at ten million rows, so I have no explanation — only a hypothesis: a hundred thousand random heap accesses stop landing in the warm pool, and real I/O gets added on top of the computation.
I did not go check: the answer no longer changes the decision that follows from all this.
Because there is a third strategy standing right next to it.
Reading from a summary table maintained by the writing side does not depend on volume at all: 0.02–0.20 ms both on ten thousand rows and on ten million. At the upper bound that is 1470 times faster than a live view in MySQL and 4847 times faster in PostgreSQL.
Maintaining the table is not free: a full recomputation on ten million rows takes 19 seconds in MySQL and 7 seconds in PostgreSQL. For "once a day" freshness that means nothing — any option will do, REFRESH or a rebuild. For "every second" freshness the materialized view is already out of the running at a million rows: a single REFRESH lasts longer than the interval between them.
Up to tens of thousands of rows, choosing between a live view and a summary table is a matter of taste, and arguing about it is silly. Closer to a million it becomes a matter of architecture, and past a million there is no choice left.
How much is that in megabytes
The complaint about views I have heard more than any other goes: "they eat resources." I had measured time but not memory, and that was a gap in the reasoning — an aggregating view creates a temporary table, and a temporary table lives somewhere.
I counted the query's working memory, not the buffer pool: the pool is allocated up front and does not depend on how you read at all. In MySQL that is the memory growth of the connection thread from performance_schema; in PostgreSQL it is the memory of plan nodes from EXPLAIN (ANALYZE, MEMORY) plus whatever went to disk.
A simple view costs nothing here either. 75 KB against 33 KB for the direct query on a million rows, and the difference is the overhead of parsing the definition; it does not grow with volume. In PostgreSQL the plan has no working nodes at all, so there is nothing to count.
An aggregating view in MySQL costs exactly one megabyte. Not "a megabyte at a million rows and ten at ten million," but a megabyte always — as long as the predicate is pushed down. When it is not, the whole result of the view lands in the table: I turned pushdown off with a hint on the same query and got 15,535 KB instead of 1262, and 12.8 seconds instead of 59 milliseconds. That megabyte is a block of the TempTable allocator, which is allocated in full for any temporary table, even one holding a thirty-row result. The direct aggregate spends the same 1082–1181 KB.
Then came something I did not expect. The cascade of three views took 13,706 KB on a million rows and the same 13,706 KB on ten million. I decided the measurement was broken and went to check. The measurement was fine: grouping memory is determined by the number of groups, not the number of rows. My data has 48,000 "merchant × day" combinations — seventy-five merchants across 640 days — and that is a ceiling which does not move no matter how many orders you load.
The record of the series was set by a query with no view in it at all. That same single-pass report, the one that turned out twice as slow as the cascade in MySQL, took 526 MB on ten million rows and was the only query in the whole series to spill into an on-disk temporary table: it joins orders with the reference table before grouping, and seven and a half million rows get materialized in full. The cascade on the same data takes 13.7 MB — thirty-nine times less.
Reading from a summary table takes 24 KB at any volume and zero temporary tables. A ready snapshot has nothing to compute, so it has nothing to hold in memory.
The line between the strategies runs through time and disk spill, not through megabytes.
Symptoms of a VIEW problem
If a heavy view already lives in your production, it looks like this: CPU and temporary objects grow for no clear reason, and reports degrade in a step rather than smoothly. What to watch: Created_tmp_tables and Created_tmp_disk_tables in MySQL, temp_bytes in pg_stat_database in PostgreSQL. After that, run EXPLAIN ANALYZE on the suspect and look for views in the hot path through performance_schema or pg_stat_statements.
Takeaways
- A simple view really does consume no resources; both engines look straight through it.
- Without MERGE, TEMPTABLE and rewrite rules you cannot explain either the thirteenfold difference on the aggregate or the fiftyfold one at scale.
- In MySQL, cascading views can be considered an optimization technique.
- An aggregating view in the hot path is a bad approach: its cost grows faster than the data, and in PostgreSQL it grows by multiples.
ORDER BYinside a view breeds silent bugs instead of convenience.- A materialized view pays off only where reads greatly outnumber writes and data lag upsets nobody.
- A summary table with incremental maintenance is orders of magnitude cheaper and does not depend on volume, which is why my aggregates often live in separate tables.
- The resource consumption of an aggregating view comes down to the columns it exposes. The index sits on the neighbouring column, and there is no way to reach it from the query. The wording sounds smaller than it is, but in practice it decides more: it tells you what to fix.
- On memory consumption, views in modern engines are in good shape and no longer deserve the worry they used to get.
Where views are worth using:
- a reusable filter and a stable read contract;
- permission separation — with caveats about security_invoker and
security_barrierin PostgreSQL andSQL SECURITYin MySQL; - gentle migration, where an old application reads an old interface on top of a new schema;
- legacy that is easier to wrap than to rewrite;
- dashboards on a materialized view when writes are rare.
The list of niches I named at that interview has not changed by a single item. What changed is something else: behind every item there is now a query plan instead of a habit.