150 queries in one flush, and 4343 green tests. How I built an N+1 detector and how it fooled me
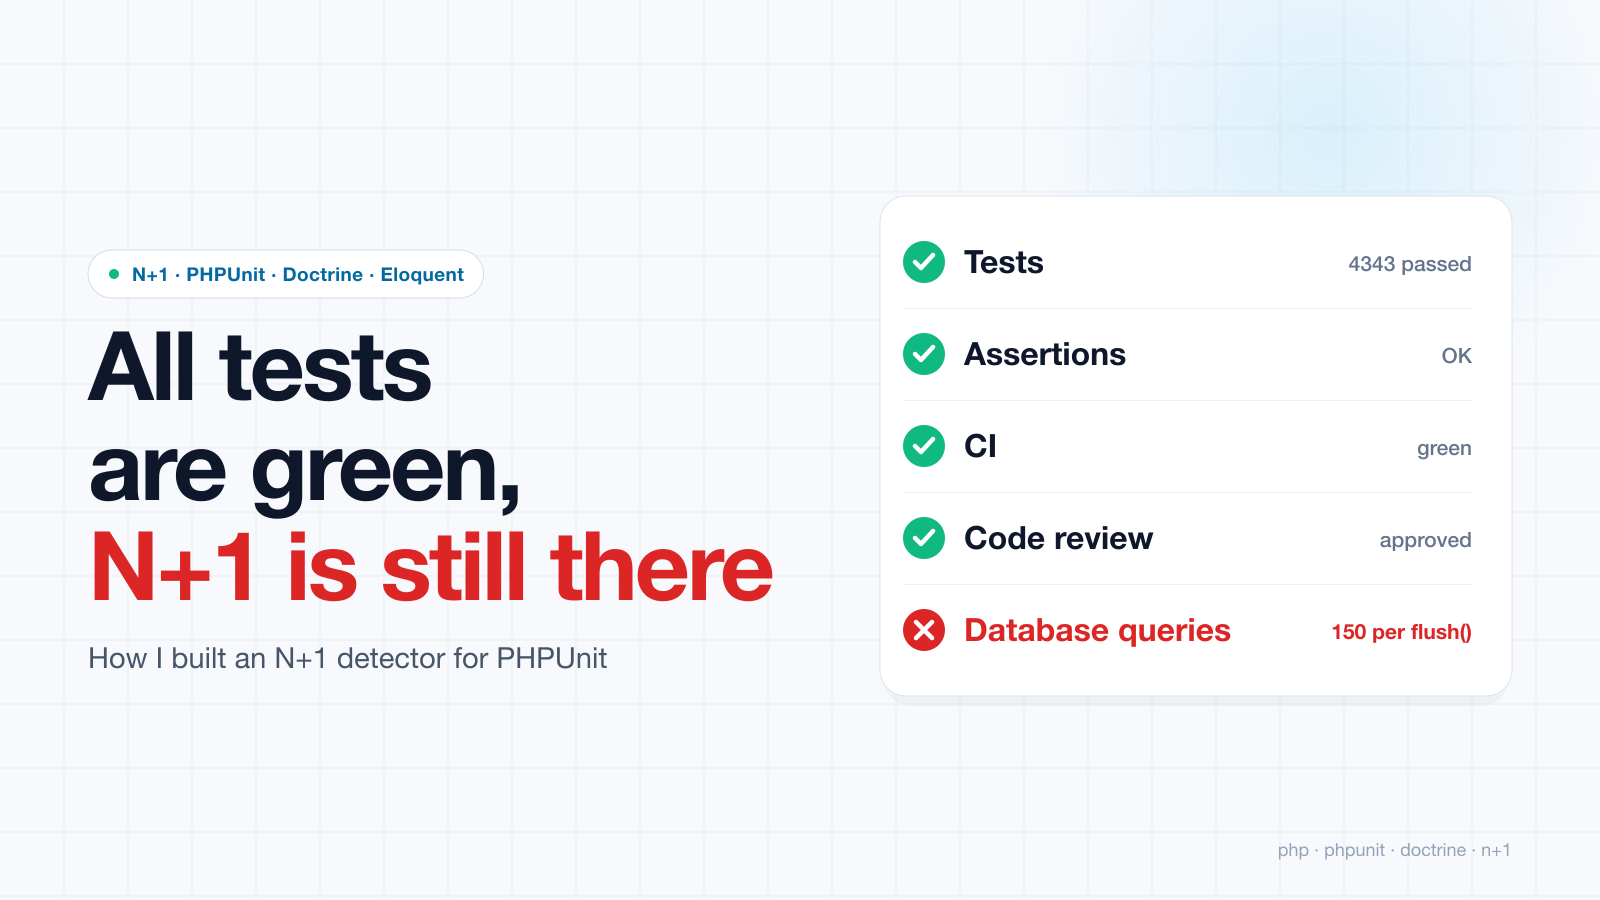
An open-source time tracker built on Symfony has 4343 tests, and every one of them passes. Yet each time entry it saves sends three extra SELECT queries to the database: the rate of the entry itself, the rate of the project, and the rate of the activity. With 50 entries in one flush(), which is exactly how many rows the bulk edit page shows, the rates alone cost 150 queries. The tests cover this code, and none of them fails: not one of them checks for problems with database queries.
To solve this problem, I built a tool that did not exist yet at the end of August. Before it ever looked for N+1 in other people's projects, though, it managed to fool me several times, and always the same way: it showed green where it was not working at all.
2000 queries for one page
Years ago I worked on a project that more or less worked, but people kept complaining: some pages were painfully slow to open, and the whole service would "hang" from time to time. The search took a long time, and the culprit turned out to be lazy loading over an unbounded list in the staff section. A single page load cost more than 2000 database queries. When a few staff members opened that page at once, the entire service effectively "died".
Once I cleaned up those places, the project handled its load on modest hardware without trouble. A few years later, long after I had left, the CTO got in touch, puzzled: the old project held the load, while the new one, with a database cluster, several application servers, and a Redis cluster, did not, although the features and the number of users were practically the same.
What I took away from that story was an uncomfortable observation. Tracking by hand which queries go out and in what order takes a very long time, and it guarantees nothing for the future, because six months later someone adds one more relation to a template. This has to be caught during development, not through a bug report from users and a drop in "conversion".
It came back to me while I was writing an article about VIEWs in MySQL and PostgreSQL, where once again I spent hours reading query plans. I made a note to myself: a PHP linter that collects every SELECT in a project, runs EXPLAIN on each one and reports errors like PHPStan does, only about performance. Almost everything in that sentence had to change later.
A ready-made package said green
First I looked for existing solutions. The closest in spirit was a popular package: a PHPUnit trait with query counters, duplicate detection, and plan analysis, advertised as supporting Laravel and Doctrine. I installed it on my own project (Symfony, Doctrine, PostgreSQL 17) and wrote a trial N+1: five lots, each with its own tender, findAll() and a read of the tender in a loop.
read phase, queries: 6
  1) SELECT ... FROM lots t0
  2) SELECT ... FROM tenders t0 WHERE t0.id = ?
  ...
  6) SELECT ... FROM tenders t0 WHERE t0.id = ?
duplicates found (SQL + bindings match): 0
assertQueriesAreEfficient() on a plain N+1: PASSED
assertNoLazyLoading(): PASSED
Six queries instead of two, and both assertions green. The package looks for duplicates by matching SQL and values, and in an N+1 the values differ by definition. The lazy loading check returns green on Doctrine without checking anything. Plan analysis on PostgreSQL switches itself off silently and also reports green, even though it has not parsed a single query. On top of that, about 25 lines of configuration and three lines in the setUp() of every test class.
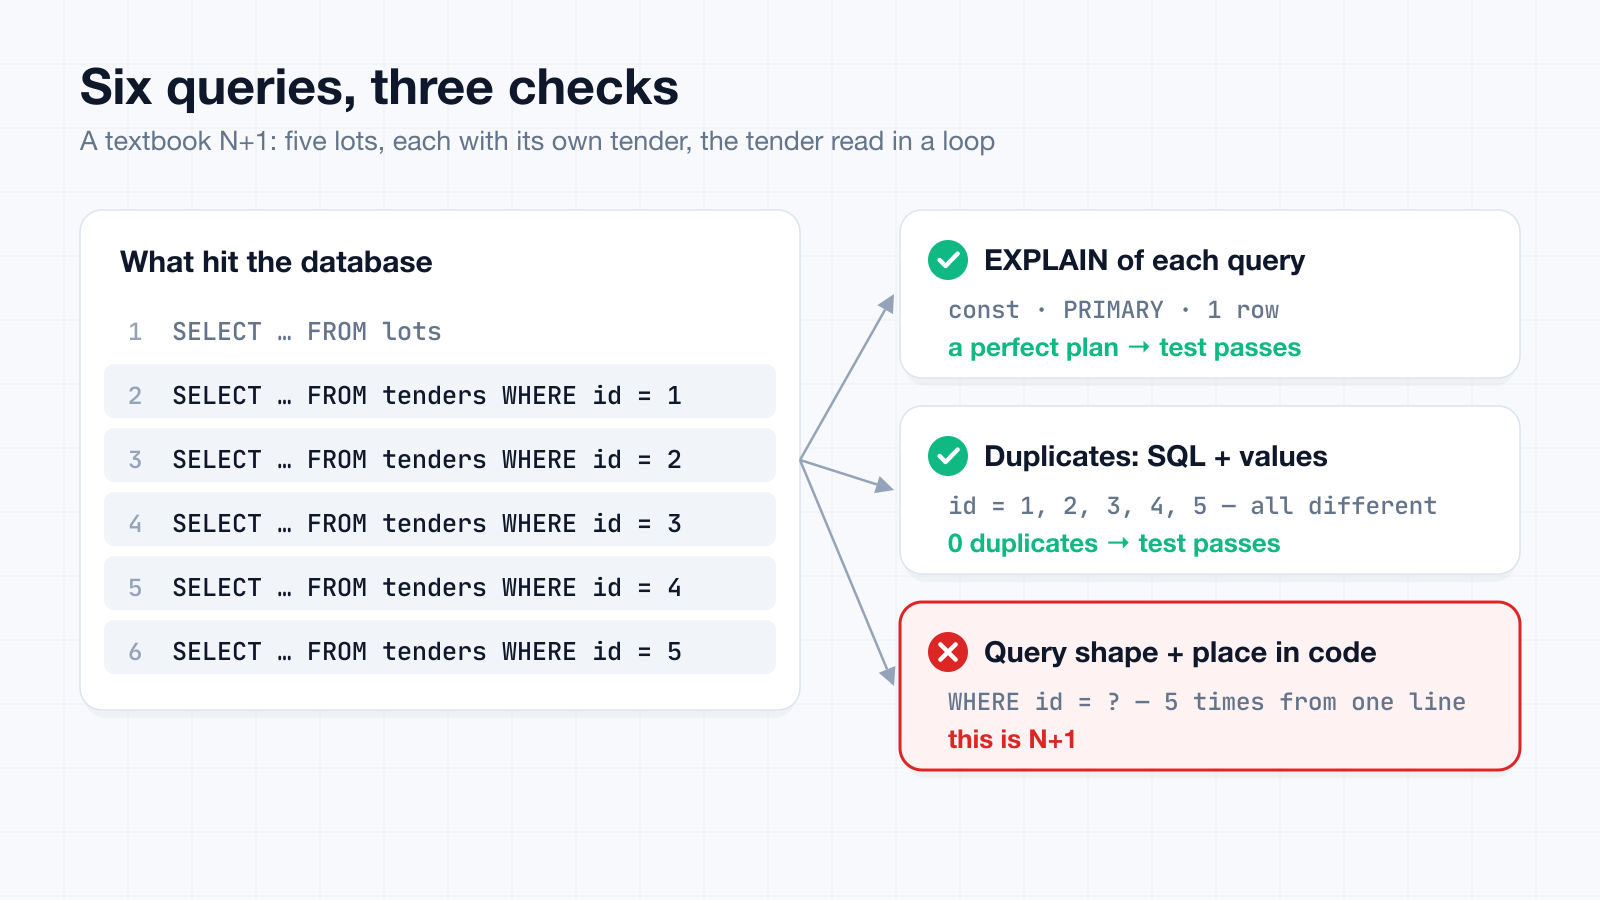
Then I repeated the check on MySQL, where everything in the package works, and the error flipped sign. The N+1 stayed invisible, because the plan of each individual query is flawless: const, PRIMARY, one row. Instead, a table of five rows got error: Full table scan, and the file:line in the report pointed inside the package itself.
The package answers the question "how many queries does this test make", and I needed a different answer. Static analysis such as phpstan-dba does not give it either: with an ORM, the code contains almost no "raw" queries for phpstan-dba to analyze, and the queries only appear at runtime.
I threw away the first version entirely
The first design came out impressive: three packages, runtime query collection with a dump to a file, a separate PHPStan rule that reads the dump and maps findings to code, plus a hash and a git revision so that the dump would not drift away from the code.
I started writing down why each part was needed, and it turned out that everything rested on a single reason: collection and analysis lived in different processes. If you do everything in one process, right during the test run, the call stack is alive, file:line is available on the spot, and there is nothing to serialize or reconcile.
That is how the tool became a PHPUnit extension. In the PHPUnit 10+ event system one test gives one trace, and N+1 can only be seen in a trace. The word "linter" had to go, because a linter reads code without running it, and here we deal with a live run. EXPLAIN stopped being the foundation too, since the main rule does not need it. In the end I dropped the working name php-linter-explain because it did not reflect what the thing does, and called the package query-guard.
There is a limitation as well: the tool sees only what the tests cover, and a controller without tests does not exist for it.
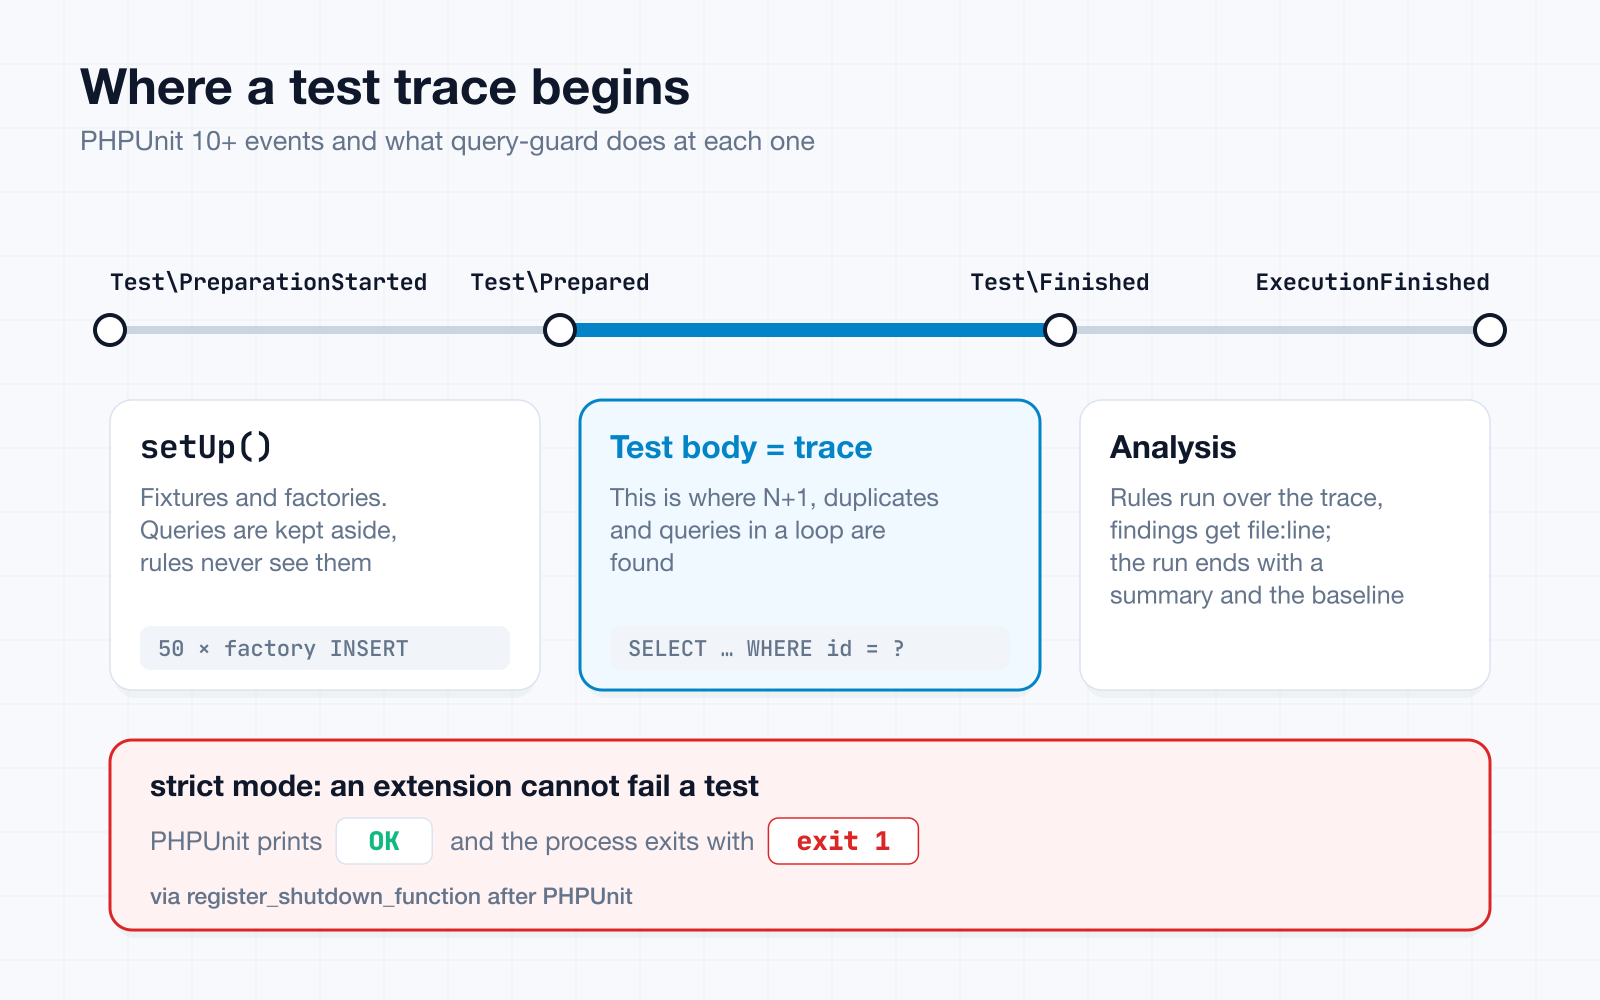
setUp(), and strict fails the run through the exit code, not the testThe first thing to decide was where to open the trace. If it opens at the very start of test preparation, setUp() ends up inside it. A factory that creates 50 entities in a loop produces 50 identical INSERTs from one place, which is a perfect false positive for the flagship rule. With that much noise the tool is useless. So the trace opens on the Test\Prepared event, after setUp(), and fixture queries are collected separately. I checked with tests that Prepared really arrives after setUp(): three queries in setUp(), two in the test body, and only the two end up in the trace.
Then came strict mode. I wanted a finding to fail the test. The PHPUnit 10–13 event system lets an extension neither mark a test as failed nor change the exit code. The only thing that worked was register_shutdown_function, which runs after PHPUnit has finished. As a result PHPUnit prints OK while the process exits with 1. CI understands that; a human stares at the output in confusion. The wording "a finding fails the test" had to become "a finding fails the run".
For the same reason, baseline generation is switched on by an environment variable rather than a command-line option: an extension cannot add its own option to phpunit either.
EXPLAIN on an empty database
The hardest thing to accept was that EXPLAIN on a test database is useless. I really wanted a regular test run to give me a meaningful picture from EXPLAIN: a full scan here, a filesort there, a missing index over there. But a test database holds three fixture rows. With three rows the optimizer honestly picks a full scan because it is cheaper, and the plan tells you nothing about production. The Full table scan on five rows from the ready-made package came from exactly that attempt to judge a plan without data.
So the rules had to be split into two tiers. The first tier does not depend on data volume and works right away: N+1, duplicates, queries in a loop, a missing LIMIT, a query budget per test. This is the main reason to install the package.
The second tier reads plans: table-scan, filesort, temporary-table, no-possible-index. It is off by default and turns on together with a pointer to a database that has real volume. While a table has fewer than 1000 rows, the plan rules stay quiet. There is one exception: a missing suitable index. That is a fact about the schema, and it holds for an empty table just as well.
I wrote plan parsing for MySQL and PostgreSQL at once, on a synthetic rig with 100,000 rows. Had I started with one platform, the quirks of MySQL or PostgreSQL would have quietly leaked into the normalized plan model.
Take the query WHERE plain_col = 42 against a 100,000-row table with no index on that column. MySQL reports rows_examined_per_scan: 99989, meaning how many rows it will examine. PostgreSQL reports Plan Rows: 100, meaning how many rows it will return after the filter. The second number says nothing about table size, so for PostgreSQL the size has to be queried separately.
And PostgreSQL has no notion of possible_keys at all, so the no-possible-index rule cannot work there. If it simply stayed silent, I would repeat the ready-made package's mistake, so the summary says that no-possible-index cannot judge on this platform.
A stub that paid off on day one
I split the architecture along three independent axes: the ORM adapter (how queries are intercepted), the platform driver (how a plan is read), and the runner shell (where the trace boundary comes from). Doctrine on PostgreSQL and Eloquent on PostgreSQL share the same plan parsing. Mix up the axes, and you get classes like DoctrineMysqlAnalyzer and four implementations where two would do.
Doctrine came first: none of the tools I found caught N+1 for it, and that was what I needed most. But I added the Eloquent adapter at the same time, almost empty. Designing an abstraction for a second implementation that does not exist yet is a reliable way to get it wrong.
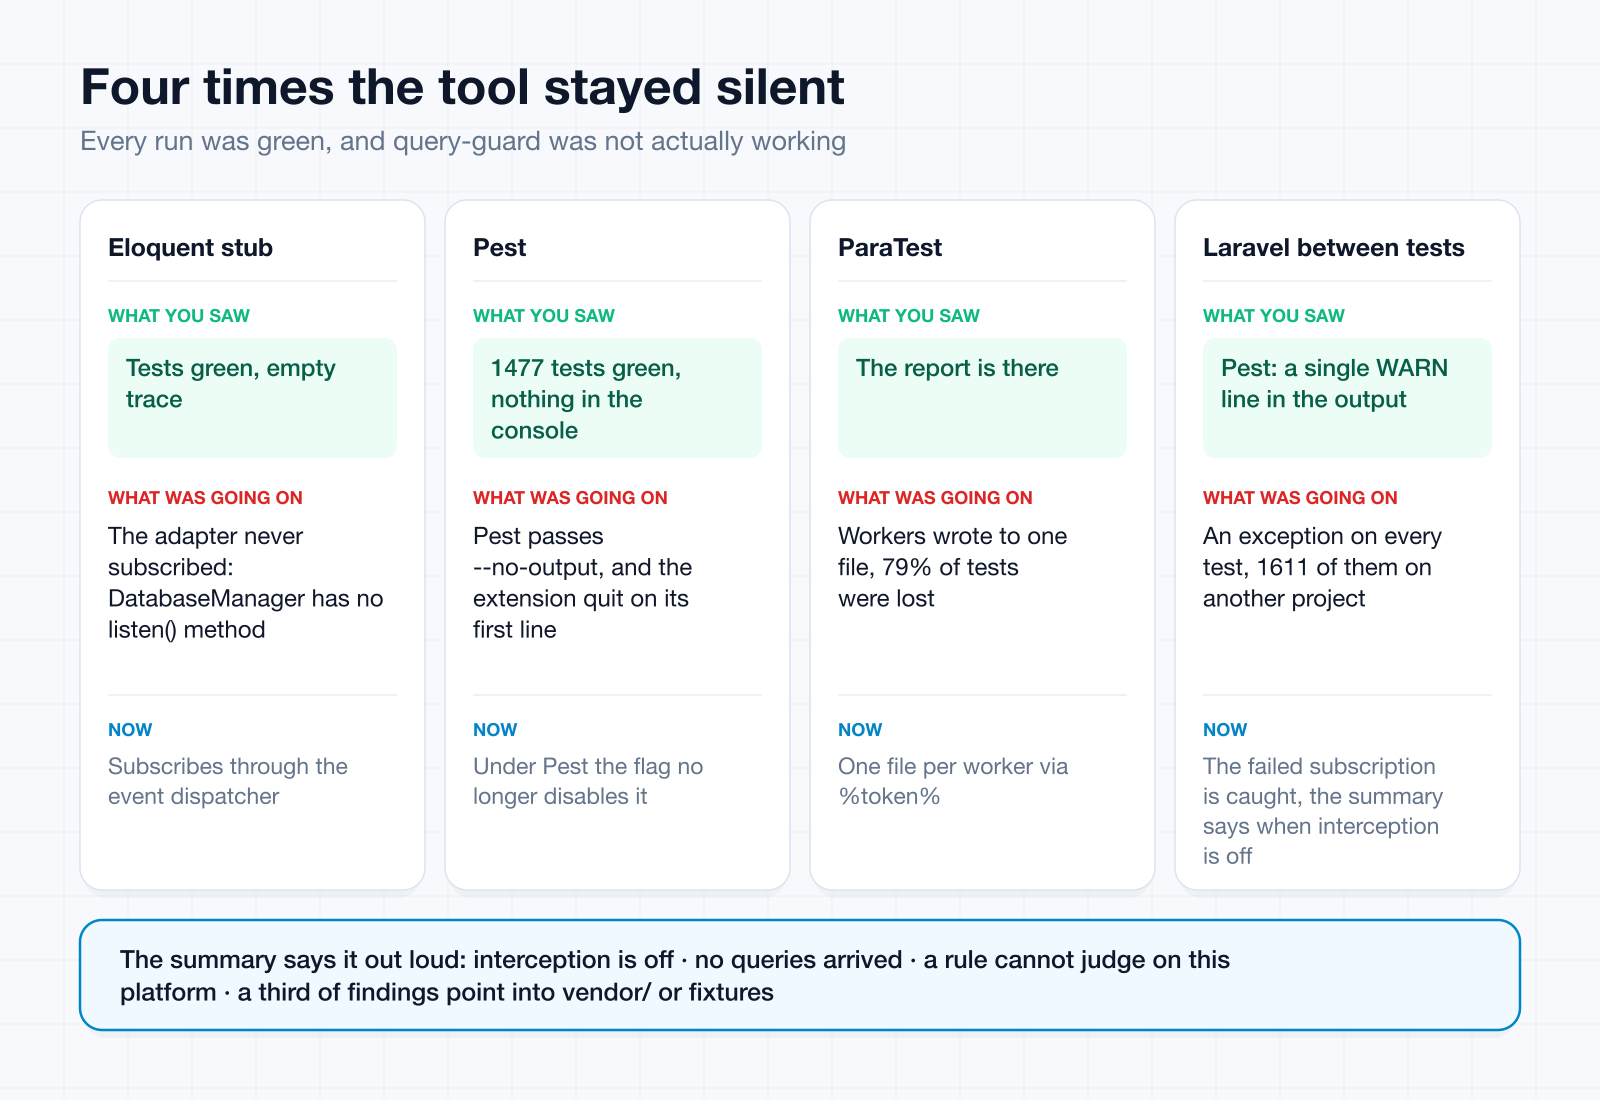
The stub broke on the first real Laravel app. The adapter checked method_exists() for listen on DatabaseManager and silently did not subscribe, because there is no such method. DB::listen() works through the magic __call and goes to the default connection. The right place to subscribe turned out to be the event dispatcher, where one subscription covers every connection, including ones created later.
The second surprise: a Laravel test application is created inside setUp(), so subscribing at the start of test preparation is too early; the facade is either empty or points at the previous test's application.
The tests stayed green all along, and the trace stayed empty. I caught that silent failure right away, but __call('listen') came back later, on the music server.
The first number
For Doctrine, I wrote my own DBAL middleware, with wrappers around Driver, Connection, and Statement, separately for DBAL 3 and DBAL 4, because their signatures of exec(), bindValue() and execute() differ. The stock logging middleware did not fit, because it logs a query before execution and has no duration.
The N+1 rule itself is simple: one query shape with the values stripped out, one place in the code, different values, at least three repeats, and reads only. Batched lookups with IN (?, ?, ?) do not count, since that is exactly how N+1 gets fixed.
The time tracker's controller tests: 404 tests, 25,736 queries, 205 hits in 21 places in the code. Places matter more than hits, because places are what you fix.
Then came enrichment for Doctrine. When a query comes from initializing a lazy collection, the stack holds a PersistentCollection object, which tells you the owning entity and the field name. Such a finding gets the error level and names the association, while everything else stays a warning-level heuristic. In Doctrine ORM 3 with PHP 8.4 native lazy objects there is no entity in the stack at all: the initializer is a static closure, and it has to be recognized by the class of the frame. Both modes are supported. After enrichment the same suite gave 207 hits, and 14 of them in 7 places got the association name.
This is what the summary looks like now (class names and paths replaced):
query-guard
  tests traced: 404, queries: 25736 (in setUp: 0)

  findings: 207

  * [error] n-plus-one — App\Tests\Controller\EntryControllerTest::testExport
    App\Entity\Entry::$tags — lazy-loaded association, 10 queries
    src/Entity/Entry.php:418

  * [warning] n-plus-one — App\Tests\Controller\EntryControllerTest::testSaveRates
    50 queries of the same shape from one place, different values: SELECT ...
    src/Repository/EntryRepository.php:810
      from src/Pricing/RateService.php:96 App\Repository\EntryRepository::findRates
      from src/Controller/EntryController.php:212 App\Pricing\RateService::calculate
A legacy project needs a baseline. Otherwise, the first install produces hundreds of findings, nobody can work through them all at once, and the tool gets removed the same day. On the time tracker, 75 hits across 43 tests collapsed into 24 signatures, the rerun came out clean, and strict without a baseline exited with 1. A signature is the rule, the file, and the query shape, without the line number and without the test name. A line number moves with any edit higher up in the file, a test name changes on rename, and either would reset the baseline.
Seven projects that were not mine
I picked open-source projects with living test suites and different stacks: three Doctrine mapping styles (attributes, XML, and ClassMetadataBuilder), DBAL 3 and 4, MySQL, MariaDB, PostgreSQL, and SQLite, plain PHPUnit, and Pest. The routine was always the same: install the package, run their tests as they are, and trace the findings down to production code.
The CMS: I blamed the wrong code
The CMS ships ready-made environments for MySQL, MariaDB, and PostgreSQL in its repository. I ran the extension on all three, and the verdicts matched.
There was one confirmed lazy load: the collection of file versions on a media item. The report showed only the place the query came from, and that was an entity getter called from everywhere. It did not say who called it this time, so I filled in the gap myself. A media getter, I reasoned, so the culprit must be the code that returns media through the API. That is what I wrote in the issue: the N+1 happens when the API reads a list of media.
The maintainer objected, and with good reason. When media is read, the needed file version is fetched by the same query through a JOIN, so there can be no separate load there. Where was the real case, then? I reran the tests, this time saving the full stack of every query. The code that returns media through the API did not appear in a single stack. Every lazy load happened on save, not on read. When a PATCH request adds or removes media on a contact, an activity log event is created for each of those media items, and each event loads the file versions with a query of its own. Two added and two removed media items make four queries. The problem turned out smaller than I had described, and in a different place entirely.
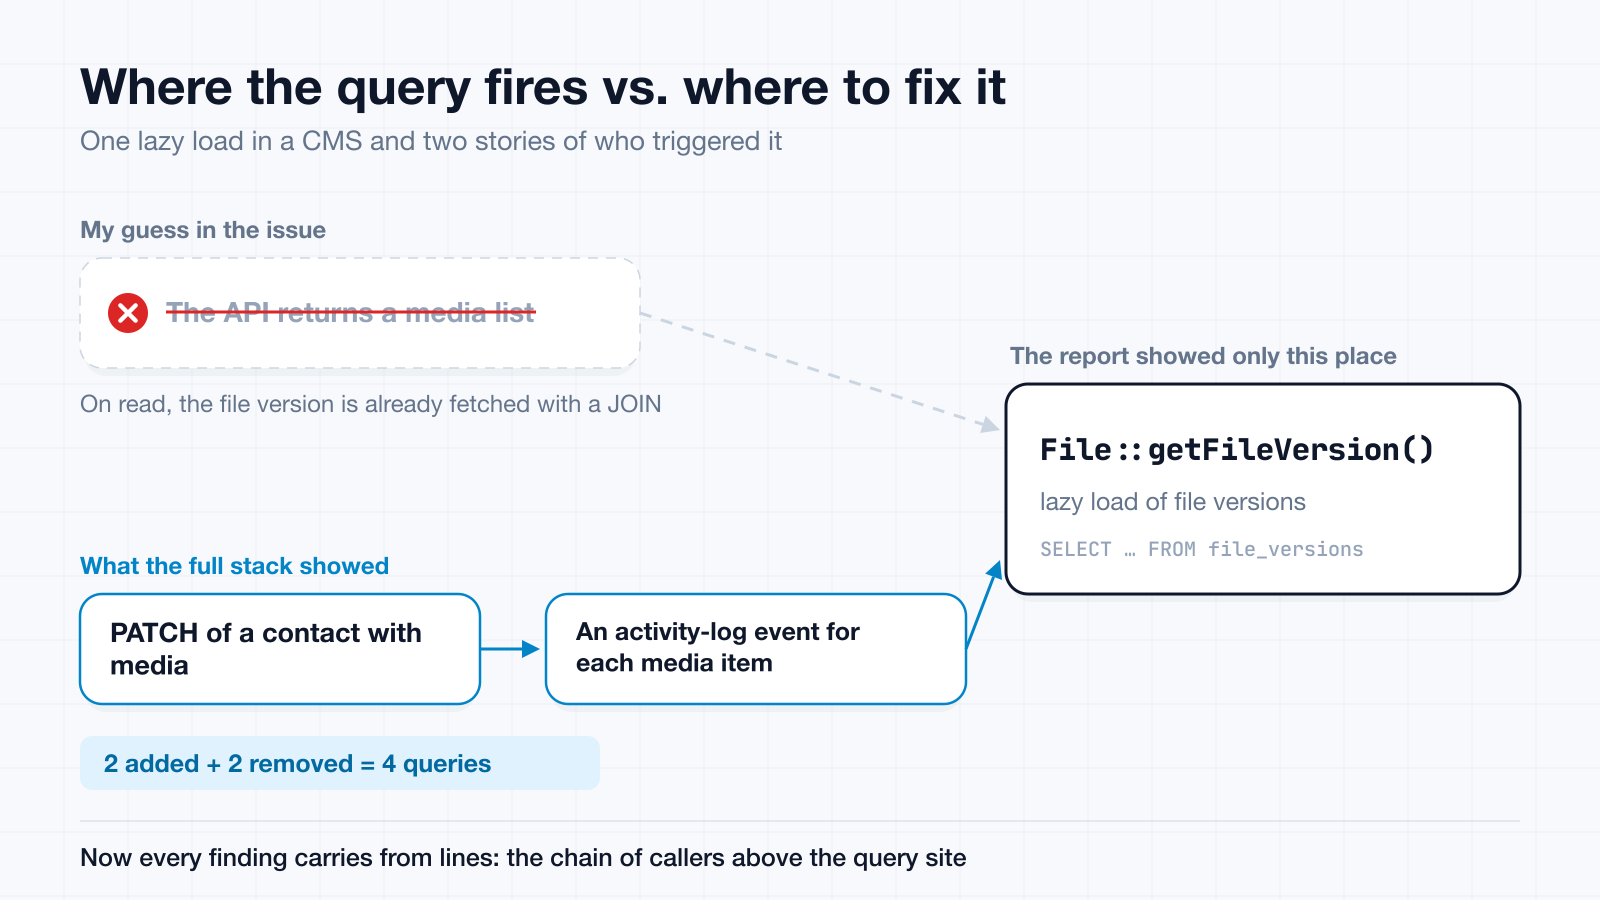
That mistake is why the summary now has from lines: the chain of callers leading up to the query.
The time tracker: where 150 queries come from
The full suite, 4343 tests and 38,103 queries: 1182 hits in 84 places, 9 of them with confirmed lazy loading. I applied the lesson from the CMS right away: no finding was described by the query site alone, each one had the full stack under it. Three made it down to production code, and I filed an issue for each.
The biggest of them is the rate recalculation from the start of this article, and the stack helped again. The largest counters in the report, 50 repeats each, came from a fixture that creates 50 entries in one flush(). Judging by those numbers alone, the finding looked like a test artifact. I had to measure the production bulk save path separately:
Entries in one flush() | Queries |
|---|---|
| 1 | 7 |
| 5 | 25 |
| 10 | 45 |
| 25 | 105 |
Exactly 4N + 5: one INSERT and three rate SELECTs per entry, which makes 205 queries for 50 entries. Schematically:
// onFlush subscriber
foreach ($scheduledEntries as $entry) {
    $this->rateService->calculate($entry); // three separate SELECTs inside
}
Rates do not change within one flush(), so in the issue I suggested a per-request cache.
The online store on Pest: green and empty
A Laravel project on Pest with 1477 tests. The run was green, but no report file appeared, and query-guard printed not a single line to the console.
My first thought: the extension did not start, something got in its way, check the logs. The logs said nothing about a crash. So, dig deeper.
I put file_put_contents on the first line of the extension's bootstrap(). The file appeared, so the extension was loading, but it quit on the very next line. Pest always adds --no-output to the PHPUnit arguments, because it prints the output itself, through Collision. And I had an early return on $configuration->noOutput(), a trick I had borrowed from a good extension for spotting slow tests. For PHPUnit that flag means "the user asked for silence"; for Pest it means "PHPUnit is not the one printing". My code read the second as the first.
A Pest user installed the package by the README and got silence that looks exactly like "no findings", which is precisely what I had set out to avoid.
With a local workaround for that condition, the run gave 158,214 queries and 12,813 hits in 742 places, and took about as long as without the extension: 424 seconds against 430. The same run exposed a second silent failure. Under pest --parallel every ParaTest worker wrote its report to the same file, overwriting the others. On a sample of 34 tests, the report kept 7, and the other 79% vanished without a word.
Out of 12,813 hits, reading the stacks and reproducing without the tool confirmed two real problems: about ten queries per cart item in every cart API response, and reading a table's schema from information_schema on every product save.
A second run on the fixed version, now with call chains, found two more. The first run had put one of them straight into "checked, not a finding", because in that test the products were created by a fixture, but it turned out that the event handler itself works the same way in production code.
The music server: 1611 warnings for 1612 tests
A Laravel project, plain PHPUnit, SQLite in memory. The first run:
OK, but there were issues!
Tests: 1612, Assertions: 11785, PHPUnit Warnings: 1611.

Exception in third-party event subscriber: Target class [config] does not exist.
__call('listen') again. Laravel empties the container in tearDown(), but until the next test's setUp() the facade keeps pointing at the previous test's DatabaseManager. The adapter asked is_callable([$manager, 'listen']) and got true, because the manager has __call. The call went into an empty container and crashed. On the stub, that magic method made the adapter silently skip the subscription; here the same method broke the subscription on every test.
The worst part was rechecking the CRM on Pest, where I had run the tool shortly before. The same exceptions had been pouring out there all along, one per test. PHPUnit puts a counter in the footer and turns OK into OK, but there were issues!. Pest prints a single WARN line in the general output, with no counter and no change to the result. Among 42 tests that line got lost, and I missed it. With someone else's suite, looking at the color is not enough; you have to read the "footer".
The music server also produced a finding of a different kind. The largest cluster in the report was an N+1 in the media library scanner that cannot happen in production. In production the artist lookup is cached, while under test the caching is deliberately turned off. The trace was accurate; it just described code that does not run that way in production.
Why silence is worse than a crash
A tool that crashes gets fixed the same day. A tool that stays silent gets removed a month later with "it never found anything useful", and nobody ever learns that it simply was not working.
After those runs the package's main rule is this: a green report and "we did not look" must not look the same. The summary tells you when no ORM was found or interception did not start, when not a single query arrived during the whole run, when a plan rule cannot work on this platform, when a third of the findings point into vendor/ or at fixtures, when the baseline was taken on a different database.
Under a parallel runner each worker writes its own report file; otherwise twelve workers would leave only the share of whichever finished last. The extension explicitly refuses to generate a baseline under ParaTest.
What came out of it
Requirements: PHP 8.2+, PHPUnit 10.5–13, Doctrine ORM 2–3 with DBAL 3–4 or Laravel 11+, MySQL, MariaDB, or PostgreSQL. The cost per query inside a test with the extension on is about 0.006 ms (0.15 seconds per 25,000 queries) and roughly 0.5 MB of memory per thousand queries.
The tool sees only what the tests query. The second-tier rules, the ones that read EXPLAIN, need a populated database. With three fixture rows a plan shows how the optimizer handles a nearly empty table, not what will happen under load, so these rules stay quiet on small tables.
The console summary is written for humans, and its wording may change. For automation there is a JSON report (report-json). It has a report format version that goes up only on incompatible changes, paths relative to the project root, and a failing field that answers a CI script's main question: will the run fail. Such a file can be read without parsing text, whether by a pipeline or by a bot that comments on pull requests.
More and more code is written by neural networks, and N+1 slips through easily: a generated controller walks a list of entities and fetches data through a relation inside the loop, the response test passes, and the diff under review does not show the sequence of queries. You cannot see that sequence by reading code, and the neural network that wrote the code cannot see it either. The more code arrives this way, the less you can rely on careful review, and the more on checks that run by themselves: linters, static analysis, tests. The query-guard package adds to them a view of the queries the code actually made. And a JSON report with the place in the code and the call chain can be handed back to the same neural network together with a task to fix it.
Repository: github.com/alex-frolov/query-guard.